

Bun is a fast, all-in-one toolkit for installing, bundling, running and testing JavaScript & TypeScript. To install: `npm i -g bun`
- Tweets4.2K
- Following7
- Followers83.6K
- Likes5.5K







ALT Chart titled "Bun AoT, ahead-of-time compilation". An Express API on SQLite: 3 middlewares, bearer auth, 4 SQL queries, 2.3 KB of JSON per request. A line chart of requests per second over the first 3 seconds from a cold start: Bun AoT is near full speed at once and settles at 14,200; Bun climbs for about a second to 14,200; Node.js reaches 7,700. Peak memory: Bun AoT 51 MB, Bun 87 MB, Node.js 138 MB. CPU per request: Bun AoT 70 µs, Bun 82 µs, Node.js 150 µs. Caption: As fast, 14% less CPU, 41% less memory than Bun.





ALT bun build --compile --aot --trim, with --trim highlighted. A block representing an 89 MB executable from Bun 1.4.4 on macOS arm64 is being cut up with scissors. The part that stays is pink: 25 MB for hello world, 34 MB with Bun.serve, 44 MB with node:http. The rest is cut into paper scraps, each crossed out: bun install, bun test, bun check, bun build, bun lint, bun fmt, WebAssembly, debugger, JIT compilers.


ALT 1. bun check: 2.42s, 2.0 GB | v1.4.4 2. tsrs: 2.50s, 2.6 GB | v0.18 3. tsc-ts: 5.9s, 5.3 GB | v0.6 4. TS 7.1 beta: 13.9s, 8.1 GB


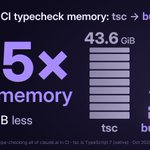
ALT Benchmark chart for bun check, Bun's built-in TypeScript type checker. It compares Bun canary, Bun 1.4.3 and tsc 7.0.2 on four projects, showing time and peak memory for a full type check. mui docs: canary 1.31s, 1.5 GiB. Bun 1.4.3 9.31s, 9.6 GiB, 7.1x slower. tsc 18.04s, 8.3 GiB, 13.8x slower. t3code server: canary 1.47s, 1.5 GiB. Bun 1.4.3 4.53s, 1.6 GiB, 3.1x slower. tsc 22.02s, 7.1 GiB, 15.0x slower. supabase studio: canary 0.63s, 1.6 GiB. Bun 1.4.3 1.67s, 1.9 GiB, 2.7x slower. tsc 8.98s, 4.5 GiB, 14.3x slower. mikro-orm: canary 1.24s, 1.6 GiB. Bun 1.4.3 2.15s, 2.0 GiB, 1.7x slower. tsc 13.41s, 6.8 GiB, 10.8x slower. Benchmarked on a 64-core machine (EPYC 9R14, Linux x64). No cache, default settings.


ALT Bun AoT VS Bun JIT Claude Code, same source, same 5-turn session. AoT runs with the JIT off. Time to interactive 165 ms 216 ms -24% Wall time launch + 5 turns 322 ms 529 ms -39% CPU time Memory at interactive 395 ms 738 ms -46% 56 MB 108 MB -48% Memory after 5 turns 82 MB 159 MB -48% 101 MB Peak memory Executable size target: +100 MB at most 194 MB -48% 430 MB 229 MB +88% Early prototype, macoS arm64. Medians of 8 runs against a fake API server on one MacBook Pro. Memory is phys_footprint. CPU is user + system, all threads. Turns in the JIT build are not CPU bound, so part of the wall time gap is waiting. 28 Sep 2026.

ALT Dark slide with the Bun logo and a "new in Bun" badge. Large headline: "Bun.FetchSession". Subtitle: "fetch() with its own connection pool." Below it, a code sample: const api = new Bun.FetchSession({ proxy: "http://proxy:8080", tls: { ca }, keepAlive: { idleTimeout: 30 }, }); await api.fetch(url); new Octokit({ request: { fetch: api.fetch }, }); "api.fetch" is highlighted in both places. Three cards at the bottom read: "Own pool: isolated keep-alive", "Proxy + TLS: set once per session", "Drop-in: works in any SDK".


ALT Table: "Bun v1.4.1 reduces idle memory usage." Resident memory 3 minutes after 60 seconds of sustained load, lower is better. Columns: Bun 1.4.1, change vs 1.4.0, Bun 1.4.0, Bun 1.3.14, Node.js 26.7. Next.js SSR: 142 MB (−36%), 222, 1303, 195. Vite dev: 157 MB (−17%), 189, 303, 155. Express: 54 MB (−17%), 65, 77, 81. Fastify: 57 MB (−16%), 68, 80, 91. Elysia: 44 MB (no change), 46, 69, 96. Hono: 34 MB (no change), 35, 53, 92. Method: 60 s at a fixed request rate (40k req/s Elysia and Hono, 25k Express and Fastify, 5k Vite dev, 3k Next.js SSR), 64 connections, then 180 s idle; RSS sampled every 100 ms on Linux x64.

ALT Two terminal boxes comparing Bun versions. Bun v1.4: $ bun ./index.js 1 | const bigBigInt = 2n ** 100_000_000n; ^ RangeError: Out of memory: BigInt generated from this operation is too big at /app/index.js:1:19 Bun Canary: $ bun ./index.js 30103000 digits


ALT bun, linux x64 v1.4.1 78.7 MB v1.4.0 80.8 MB V1.3.14 92.8 MB uncompressed binary size -2.6%